Our AI engine runs seven proven trading methods — Kullamägi’s breakouts
and episodic pivots, Minervini’s trend template, O’Neil’s CANSLIM —
across ~1,900 US stocks every session. It reads SEC filings, detects catalysts, scores
relative strength and cross-references market breadth in seconds — deep analysis that
would take hours by hand, delivered before the open. The gap scan runs live from 4:00 a.m. ET.
+147.7%in the 20 sessions after it was flagged Apr 27, 2026 → May 26, 2026
54%win rate
Momentum Breakout Scanner Last 12 months
Total of 1,853 profitable trades
+16.7% average gain per profitable trade
IBRXImmunityBio, Inc. Common StockEpisodic Pivot Scanner
+119.2%in the 20 sessions after it was flagged Jan 14, 2026 → Feb 12, 2026
44%win rate
Episodic Pivot Scanner Last 12 months
Total of 111 profitable trades
+21.0% average gain per profitable trade
MUMicron Technology, Inc. Common StockMinervini SEPA Scanner
+86.5%in the 20 sessions after it was flagged Apr 13, 2026 → May 11, 2026
53%win rate
Minervini SEPA Scanner Last 12 months
Total of 258 profitable trades
+12.8% average gain per profitable trade
AMDAdvanced Micro Devices, Inc. Common StockO’Neil CANSLIM Scanner
+85.9%in the 20 sessions after it was flagged Apr 13, 2026 → May 11, 2026
54%win rate
O’Neil CANSLIM Scanner Last 12 months
Total of 87 profitable trades
+12.4% average gain per profitable trade
Backtest of each scan’s published rules, Aug 28, 2025–Aug 27, 2026, on today’s stock universe. CANSLIM uses current fundamentals. Selected examples; past results do not predict future returns.
~1,900US stocks scanned every session
7scanners from published methods
04:00ET premarket start, every day
60slive refresh on episodic pivots
A big move on your chart doesn’t tell you why it happened.
Great earnings and a stock offering both look the same on a chart — a big gap on
heavy volume. But they’re opposite trades. Most scanners show you the move and
leave you to figure out the rest, right when you have the least time.
SwingTradeScanner reads the SEC filings and news behind every move and puts the
reason right next to the setup. Earnings beat? New contract? Dilutive offering? You
see the fundamentals alongside the chart, with a link to the actual filing.
The part other scanners leave out
A gap tells you what moved. The filing tells you why.
Every episodic pivot is matched to the SEC filing or news behind it, with a link to the source document. Earnings, profitability and float sit beside the chart, so a real re-rating and a hype spike never look the same again.
A +178% day, a same-day 8-K, and a company still losing money. You see all three before you trade it.
What traders are saying
“I used to spend two hours every night building a watchlist from scratch. Now I open SwingTradeScanner after the close and my top candidates are already ranked with the catalyst right there. It cut my prep time by 80%.”
Marcus Rivera Austin, TX
“The episodic pivot scanner caught AXON the morning of its earnings gap at 4 AM — before any alert service I subscribe to even mentioned it. That one trade paid for a full year.”
Danielle Whitmore Charlotte, NC
“What sold me is that every result shows why. I don’t have to dig through filings or guess what moved. The SEC catalyst detection alone is worth the subscription.”
Kevin Nakamura Portland, OR
“I’ve tried Finviz, TradingView, and MarketSurge. None of them run Minervini SEPA or VCP scans out of the box. This does, and it scores each setup so I know which ones to focus on first.”
Rachel Okonkwo Atlanta, GA
“The breadth dashboard saved me from forcing trades during a weak tape in August. Seeing all breadth indicators in one place gave me the confidence to sit in cash until conditions improved.”
James Callahan Denver, CO
“As someone who trades part-time around a full-time job, I need something that does the heavy lifting before the bell. The premarket scanner running at 4 AM means I walk into work with a plan already set.”
Priya Sharma Chicago, IL
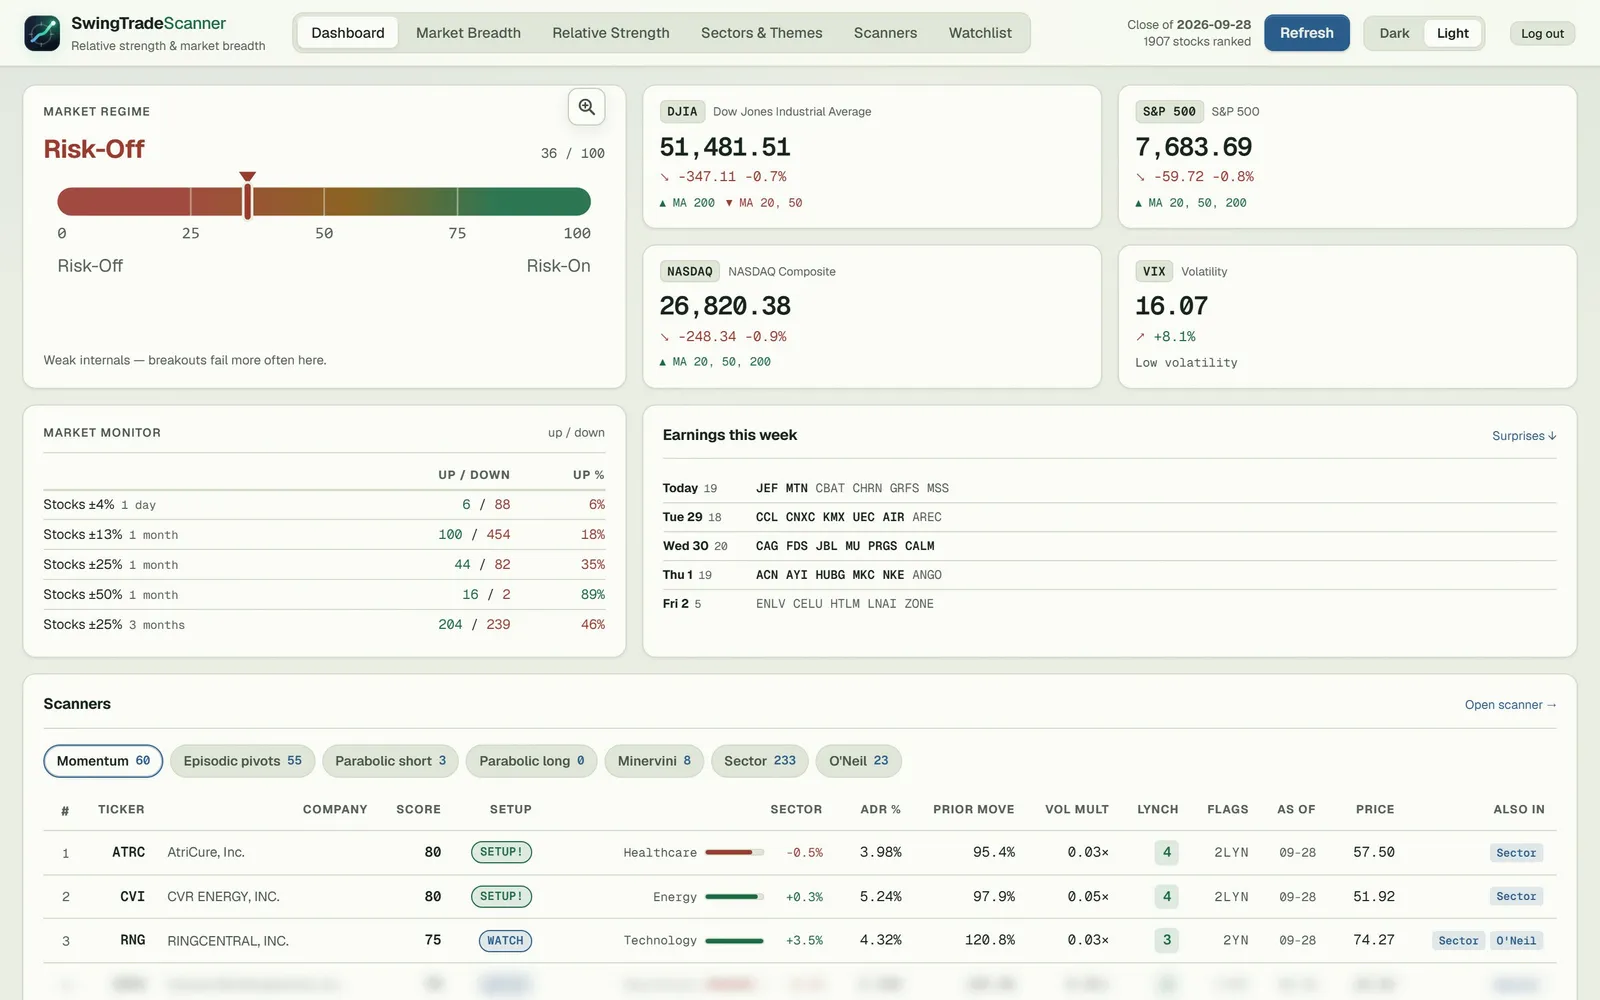
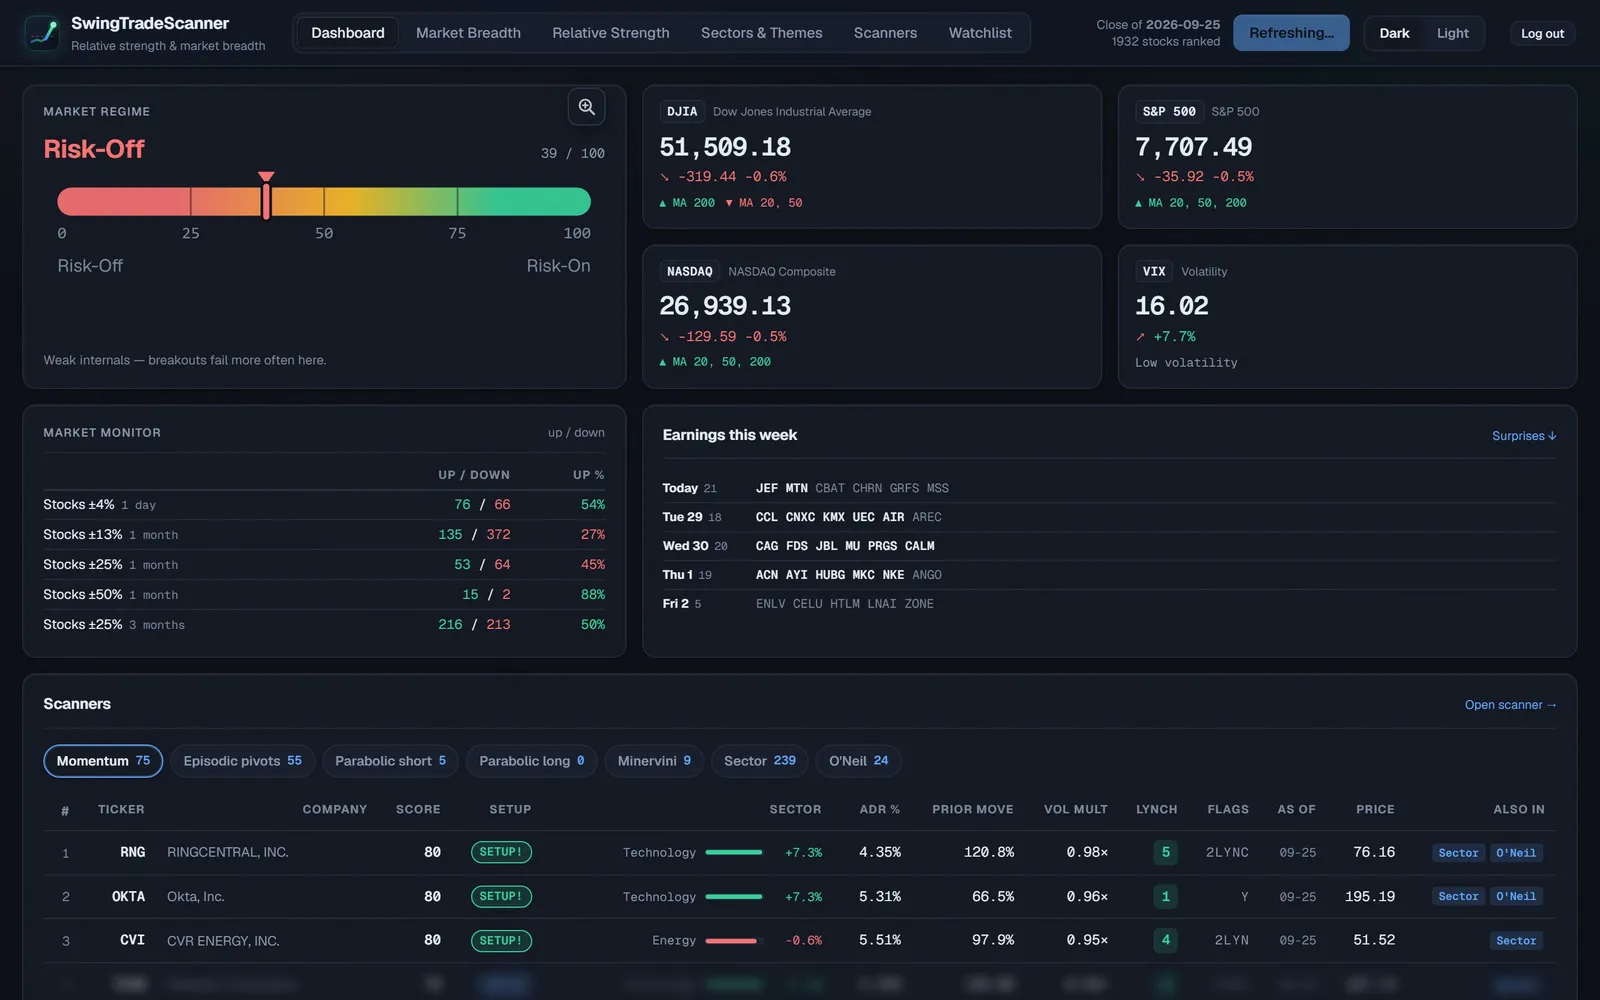
Your whole morning, on one screen
Market regime, index health, breadth, this week’s earnings and every scan result —
read top to bottom before the bell. This is the real dashboard, not a mockup.
swingtradescanner.com/app
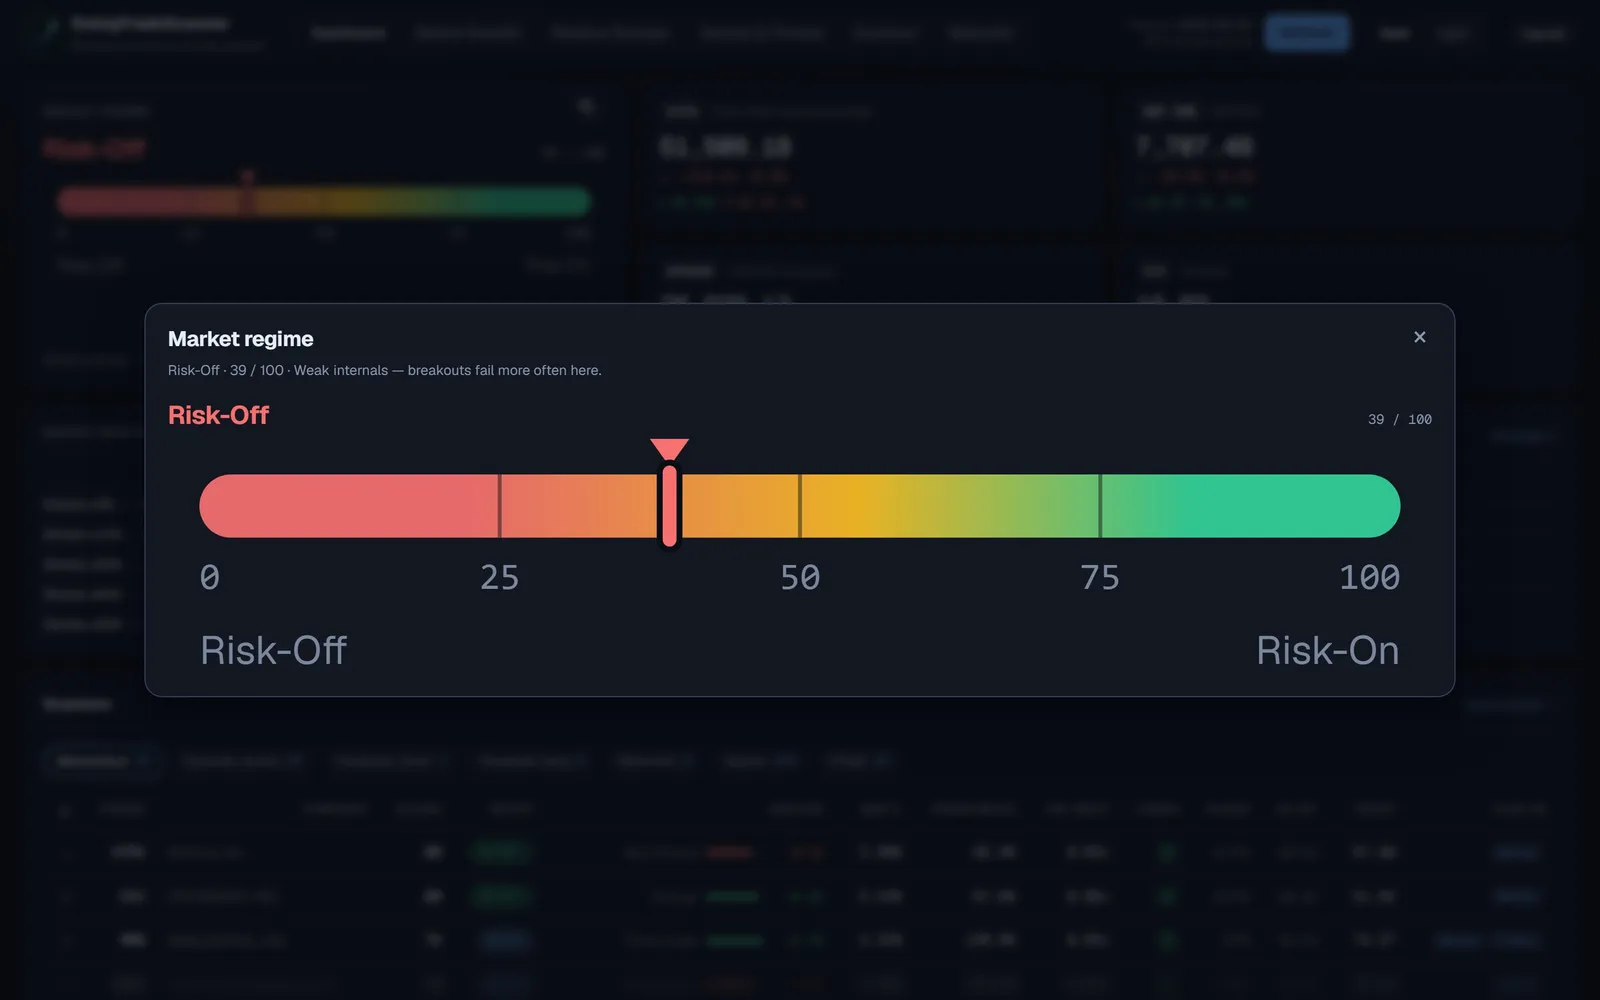
Risk-Off 36 / 100Market regime
ATRCSETUP! 80Momentum breakout
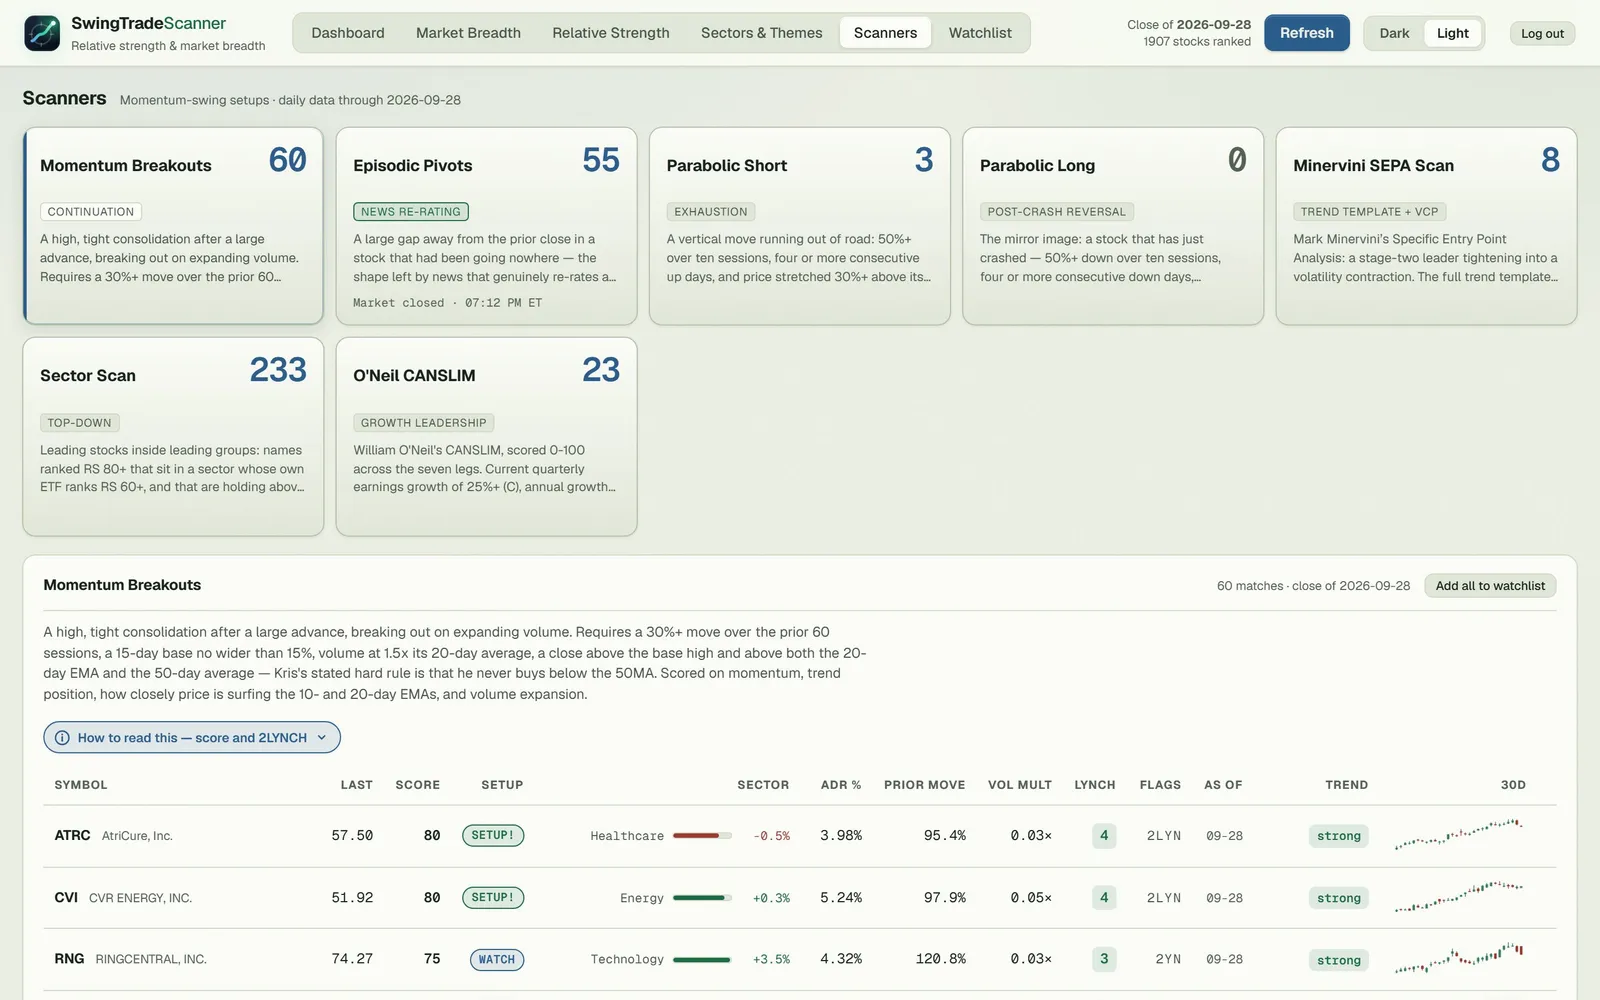
60 breakouts todayMomentum scan
A morning, step by step
Read the tape before you read a chart
The regime gauge scores market internals 0–100. Risk-off days are when breakouts fail, and you see that before your first click.
Open a scan, get a ranked list
Every result is scored, tagged with its sector’s strength and drawn as a 30-day chart right in the row.
Click a name, see the whole story
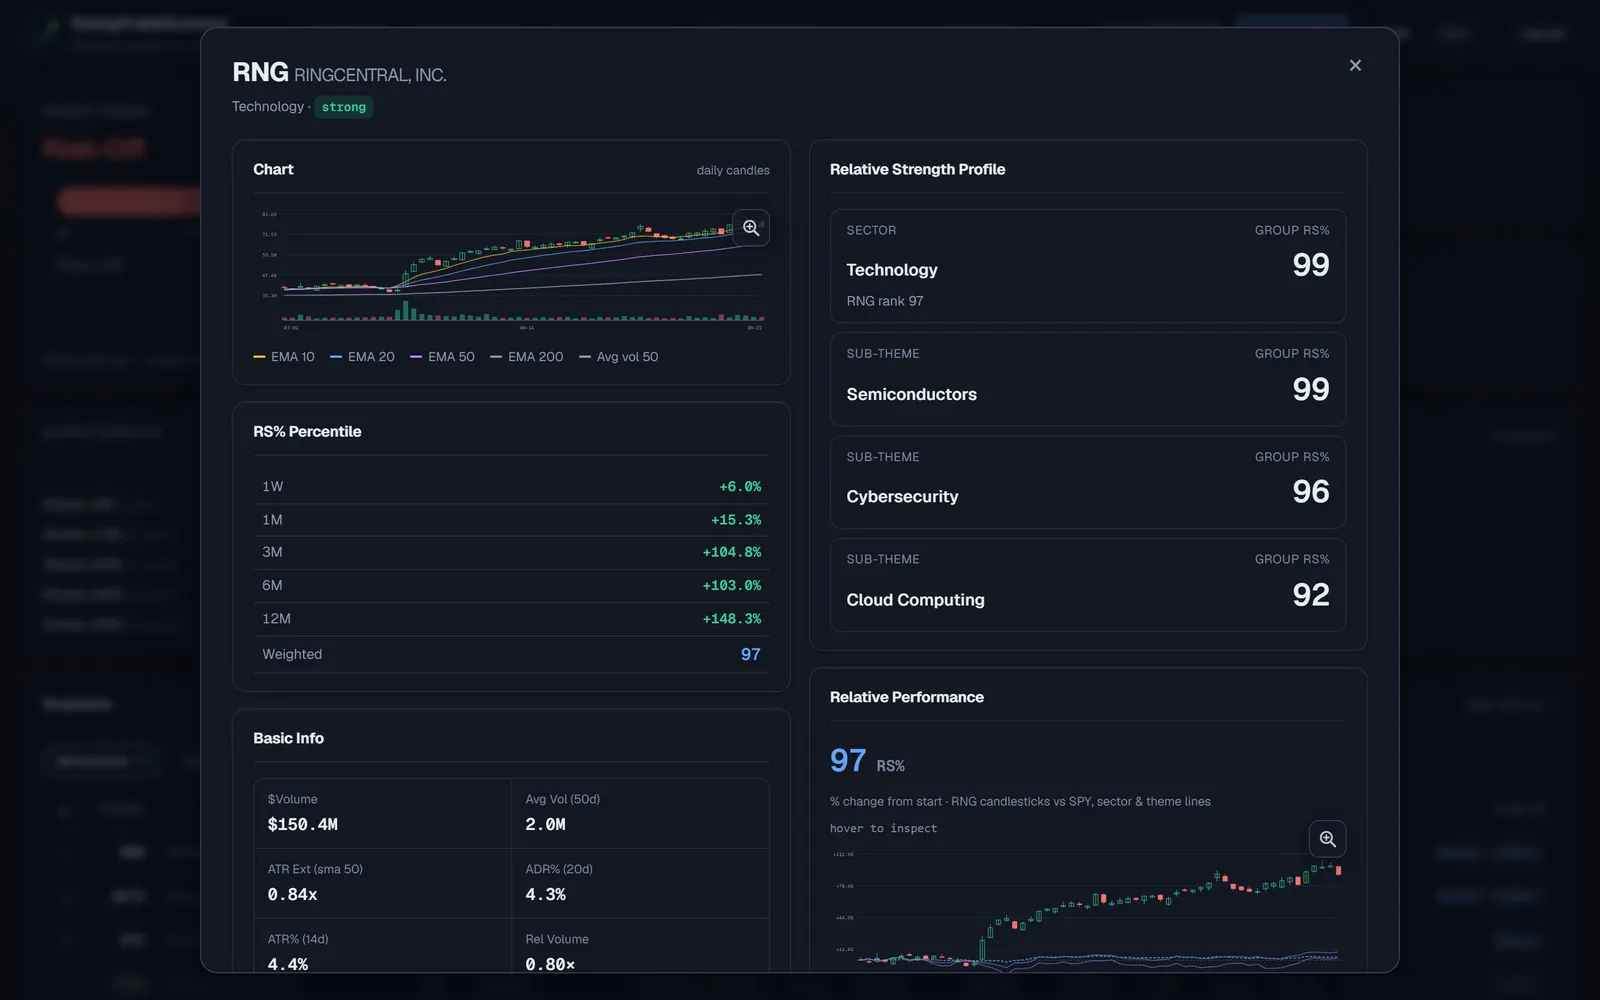
Candles with EMAs, relative strength across five timeframes, the themes it belongs to, and how it trades day to day.
Keep what’s worth watching
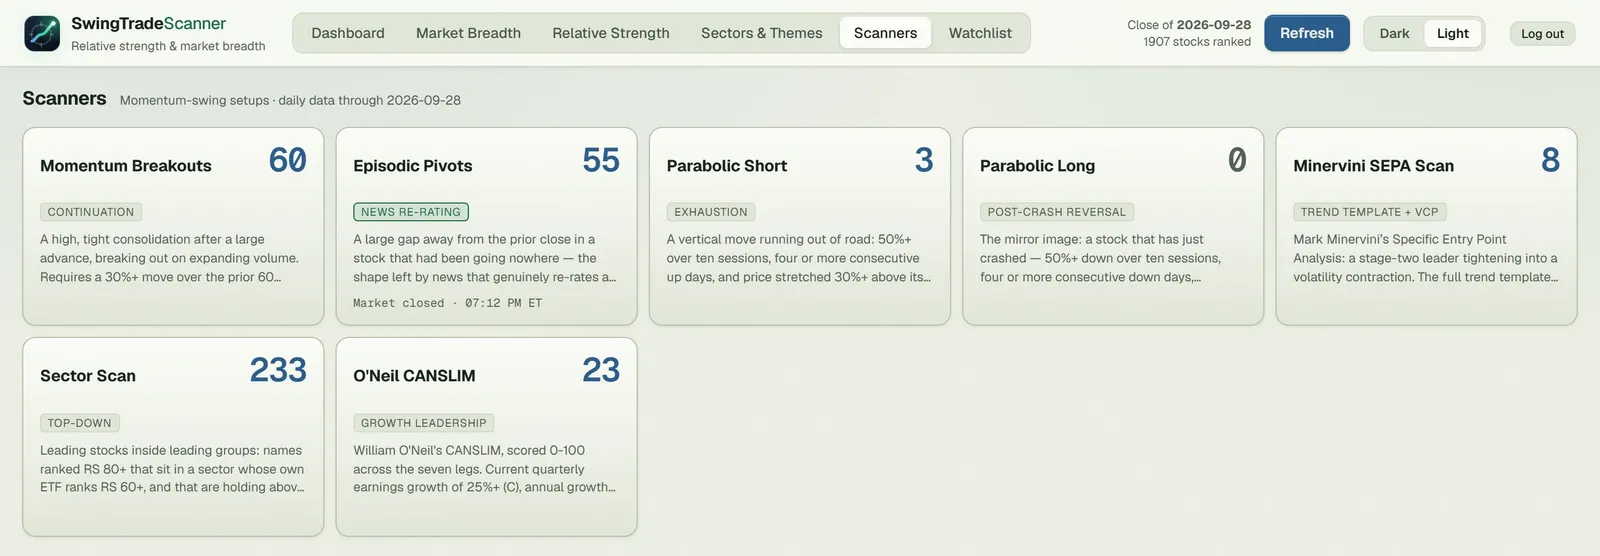
Seven scans, one board. Save a name and the watchlist remembers which scan found it and why.
Fifteen minutes, start to watchlist
Check the market first
Before you look at any setup, see how healthy the market actually is. Are most
stocks going up or down? Is money flowing in or out? Breakouts work better in
strong markets — this tells you which kind of market you’re in.
See where money is flowing
Which sectors are hot right now? Which are cooling off? See the leading stocks
inside each group, so you ride the sectors institutions are buying into.
Find your trades, with the reason attached
Run the seven scanners, read the fundamentals and the catalyst behind each result,
and save anything worth watching to a watchlist that remembers why it’s there.
~1,900 US stocks scanned every session — premarket from
04:00 ET. The universe covers all US-listed equities above
a minimum dollar-volume threshold, excluding OTC, ADRs, SPACs, and ETFs.
Charts, fundamentals, earnings data, and the catalyst behind every gap pulled
from SEC EDGAR and the news tape.
Seven scanners, each built from a published method
We independently implemented every scanner below from the published rules of the traders
who made these methods famous. The code, the scoring, and the infrastructure are ours —
we read the books and the streams, then wrote the software ourselves. Each result includes
the chart setup alongside fundamentals — earnings, revenue, filings — so you
get the full story, not just a ticker. Click any scan to see today’s results.
Every scanner was independently built by us from the published playbook of a trader
who actually trades the method. We studied their rules, wrote the code from scratch,
and added the fundamental and catalyst context on top. None of these traders is
affiliated with SwingTradeScanner — their published work is simply where the
strategy comes from.
Kristjan Kullamägi
4 scanners based on his method
A self-taught Swedish trader who turned a small account into tens of millions
trading momentum stocks. Four of our seven scanners come from his playbook:
breakouts out of tight bases, overnight gaps on real news, and parabolic moves
where exhaustion signals the trade is over.
Focuses on stocks that can actually move — not penny stocks, not slow names
Buys continuation after a stock has already proven it can run
Reads the news behind every gap so you trade the reason, not the chart alone
Mark Minervini
SEPA trend template — 1 scanner
A two-time US Investing Champion who buys the strongest stocks in the market
right before they break out. His method requires a stock to be in a confirmed
uptrend with each pullback getting shallower — a sign the sellers are
drying up and buyers are in control.
Only buys stocks in a strong, established uptrend
Looks for tightening pullbacks that show sellers running out of stock
Relative strength must be in the top tier before anything else counts
William O’Neil
CANSLIM growth screen — 1 scanner
The founder of Investor’s Business Daily and one of the most successful
growth investors in history. His CANSLIM method starts with the fundamentals
— strong earnings growth and rising annual profits are requirements, not
bonuses — then adds chart strength and institutional buying.
Earnings must be growing — no chart-only picks make the cut
The big funds have to be buying, not just retail traders
Combines fundamental and technical analysis in a single score
Kristjan Kullamägi, Mark Minervini and William O’Neil are not affiliated with
SwingTradeScanner, have not endorsed it, and were not involved in building it. Their names
appear only to credit the published methods these scanners are built from.
What you get
Technicals and fundamentals together
Every result shows the chart setup alongside earnings growth, revenue, SEC filings, and institutional data. Not just a price screen.
Relative strength rankings
Every stock ranked 1–99 against the full universe, so you always know who the leaders are.
Market breadth dashboard
See how healthy the overall market is before you take any trade. Breadth tells you when to be aggressive and when to sit tight.
Catalyst detection
The reason behind every big move — earnings, FDA approvals, contracts — pulled from SEC filings and linked to the source.
Charts on every stock
Daily candles with moving averages in every table, plus a full chart when you click any symbol.
Sector and theme rotation
See which sectors are heating up and which are cooling down, with the leading stocks inside each group.
Watchlist that remembers why
Every symbol you save records which scanner found it and when, so you still know the thesis next week.
Plain-English definitions
Hover any column header to see what it measures and how to read it. No jargon, no guessing.
Pricing
Start with a 7-day trial. No card required.
Monthly
$20/month
All seven scanners, including live premarket
Fundamentals and catalyst detection on every result
No. SwingTradeScanner finds candidates and explains the conditions behind them. Entries, stops, sizing and exits are yours. Every scan describes a condition, not a signal.
Who is it for?
Discretionary swing traders holding days to weeks who already read charts and want better candidates and faster context — not an automated system.
How current is it?
Rankings and breadth rebuild each session after the close. The episodic-pivot scan is live: it refreshes every minute while a session is running, including premarket from 04:00 ET and after hours to 20:00 ET.
Does it replace my charting platform?
No, it decides what to look at. Keep using your charts to decide how to trade it.
Can I change the thresholds?
Yes. Every scan threshold — minimum ADR, gap size, dollar volume, lookback window — is configurable, and the defaults are documented so you know what you are changing.
Can I cancel?
Any time, from your account. The trial needs no card.
Stop finding out why after the move is over
Takes a minute to set up. Your first scan builds itself.